Deep learning
Neural networks are a computational tool, which can be used for machine related tasks such as image classification, predictive analysis & forecasting, image annotation and image segmentation These consist of units known as neurons, which are inspired by biological neurons present in brain cells. When multiple neurons having a similar function are arranged together, the resulting arrangement is known as a layer. Typically neural networks have atleast three different types of layers, an input layer that is used for broadcasting the input to subsequent layers, an output layer for converting the neural network response to a form most suitable for the particular task and one or more hidden layers. The hidden layers work by mapping the input data into increasingly complex manifolds or dimensions, such that characteristics of the data can then be used to perform the machine task accurately.
Deep learning classifiers are a part of the family of neural networks, and consist of far more hidden layers than conventional neural networks. In addition, the function of each hidden layer is usually different from that of its neighboring layers. Using these different layers, deep learning classifiers can not only learn better mappings of input data, but also better combinations of these mappings. This improves the accuracy of the classifier tremendously. Hence deep learning models have been used in many state-of-the-art applications such as handwritten digit classification, self-driving cars and synthetic image synthesis, with new applications being reported regularly.
Segmentation of eating gestures.
Advisor: Dr. Adam Hoover.
Link to thesis: Segmentation and recognition of eating gestures from wrist motion using deep learning
A gesture is an activity of unspecified duration from a pre-defined set of known activities. Similar to sign-language in which specific manual articulations of the hands are associated with certain words or phrases, specific movements of the wrist during a meal can be associated with a particular gesture type. To the best of our knowledge, we are the first group of people to successfully train a neural network to simultaneously detect and classify periods of wrist-motion data into different categories. The data that was used to train our model was recorded when subjects ate an unscripted meal, and is hence more representative of the way people naturally eat their meals.
Eating related activities are those such as moving food from the plate to the mouth, moving a glass or cup to the mouth and sipping a drink while holding it, preparing a morsel of food, dipping food in sauce or gravy etc. Note that these are simple examples from among a wide range of other movements. When eating an unscripted meal, people will have different variations and durations in their wrist movement for such activities. This makes detecting such activities difficult for a large group of people. In addition, activities completely unrelated to eating also occur frequently during a meal. These include activities such as gesturing to a friend, checking one's phone or simply placing the hand at rest in between different bites. Due to the different combinations and durations of such activities in people, automatically segmenting these is a non-trivial problem.
Detecting eating gestures from a meal is one of the many ways of automatically monitoring energy intake in people, which is the core research interest within our group. Calorific intake monitoring is seen as a method for preventing overweight and obesity in people, which is certainly on the rise both in the United States of America as well as in the world.
Data
The data for our research consisted of wrist-motion activitity recorded from 276 people eating a meal at the Harcombe Dining Hall at Clemson University. Each recording contains measurements from a 3-axis accelerometer (x, y and z) and a 3-axis gyroscope (yaw, pitch and roll). These are collectively known as an intertial measurment unit (IMU). When mounted on the wrist, an accelerometer measures the orientation of the wrist relative to its three axes, while a gyroscope measures the angular velocity of the wrist during motion with respect to its own axes.
The ground truth for our model was marked by 18 trained human raters who observed subjects eating their meals using a custom tool built by our group. The raters were trained to identify certain keypoints in each window, which made the task of identifying each gesture category consistent across all raters. A total of 51,614 gestures were identified from the data set, of which data corresponding to 264 participants was retained and labeled using the following definitions:
- Bite: Any movement associated with moving food towards the mouth using one's own hand. This need not specifically include movement from a plate towards the mouth. Multiple small bites may be considered as a single gesture if these do not occur more than 1 second apart from each other.
- Drink: Same as a bite, but the subject should move the container (cup/glass) towards the mouth using their hand. Multiple sips should each be separated as individual gestures.
- Utensiling: Motion associated with getting food/beverage ready for consumption. Activities such as cutting food into bite sized pieces and stirring a liquid fall into this category of gestures. As soon as the hand starts moving towards the mouth, the associated intake gesture (bite/drink) should be used instead.
- Rest: Activity associated with periods of rest that occur in between other gestures. It ends as soon as intent to perform other activity becomes clear.
- Other: All other wrist motion such as using a napkin to clean the face, moving plates away, gesturing to a friend etc. can be treated as the other category. This category included all ambiguous activity from the earlier categories.
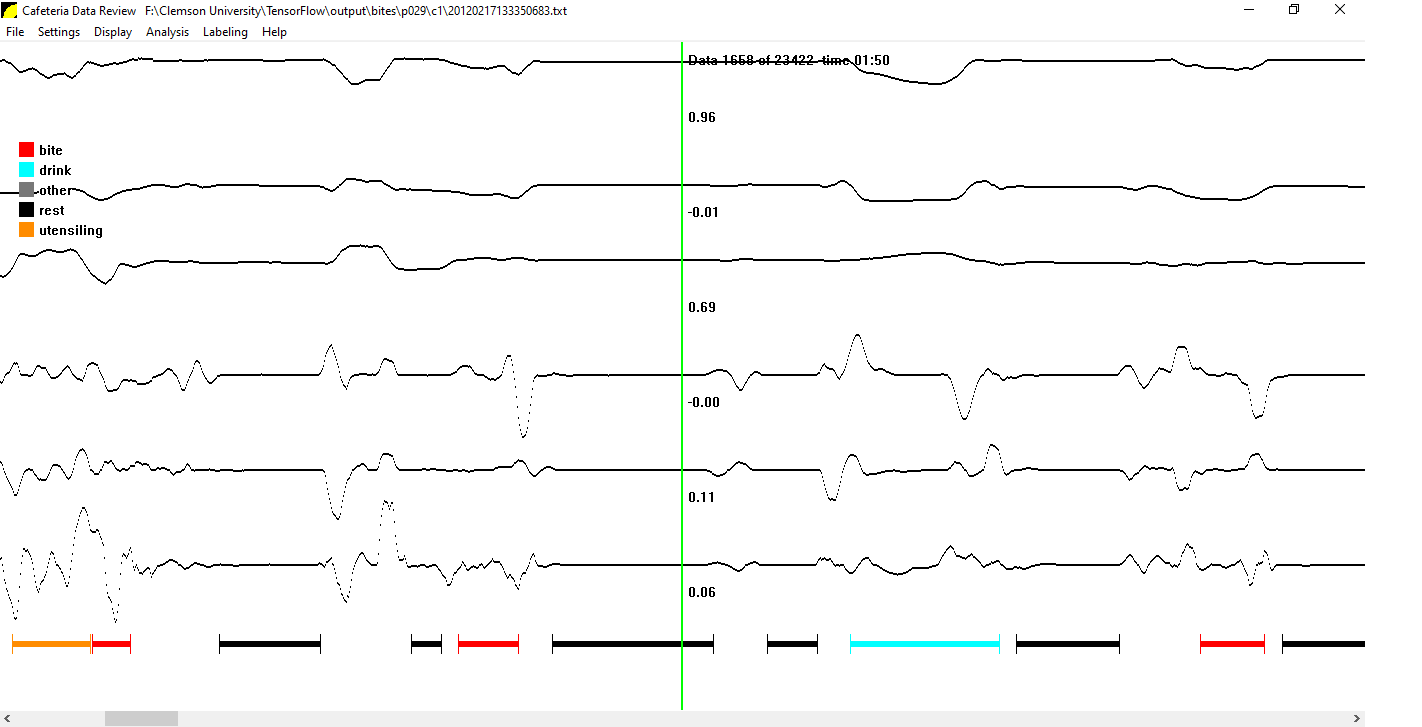
- Unlabeled: Any activity not marked by the human raters was treated as the unlabeled type. This is used to make the size of the vector of targets fed to the classifier the same size as the input. This does not appear in the display window of the custom tool shown below.
For more information on the process of generating ground truth labels, the interested reader is asked to refer to Clemson Cafeteria Dataset.
Deep learning model
Our deep learning model was inspired by the recent success of deep learning classifiers in segmenting images from The Oxford-IIIT Pet Dataset as shown in the Image segmentation tutorial on the TensorFlow website. Deep learning models have been successfully applied for image segmentation in images other than those of the Oxford-IIIT data set as well. However there has been no study reported that applied these on time-series data such as that recorded using IMU sensors.
Our pipeline uses a deep learning model, which has a stack of convolutional blocks followed by a stack of deconvolutional blocks. Other layers such as a batch normalization layer, an activation function layer etc. are used when needed similar to the model shown in Image segmentation. In such a network, convolutional blocks can be thought of as mapping blocks, which generate feature mappings from the input space to the feature space. In exactly the opposite way, deconvolutional blocks generate the mappings from the feature space to the required output space.
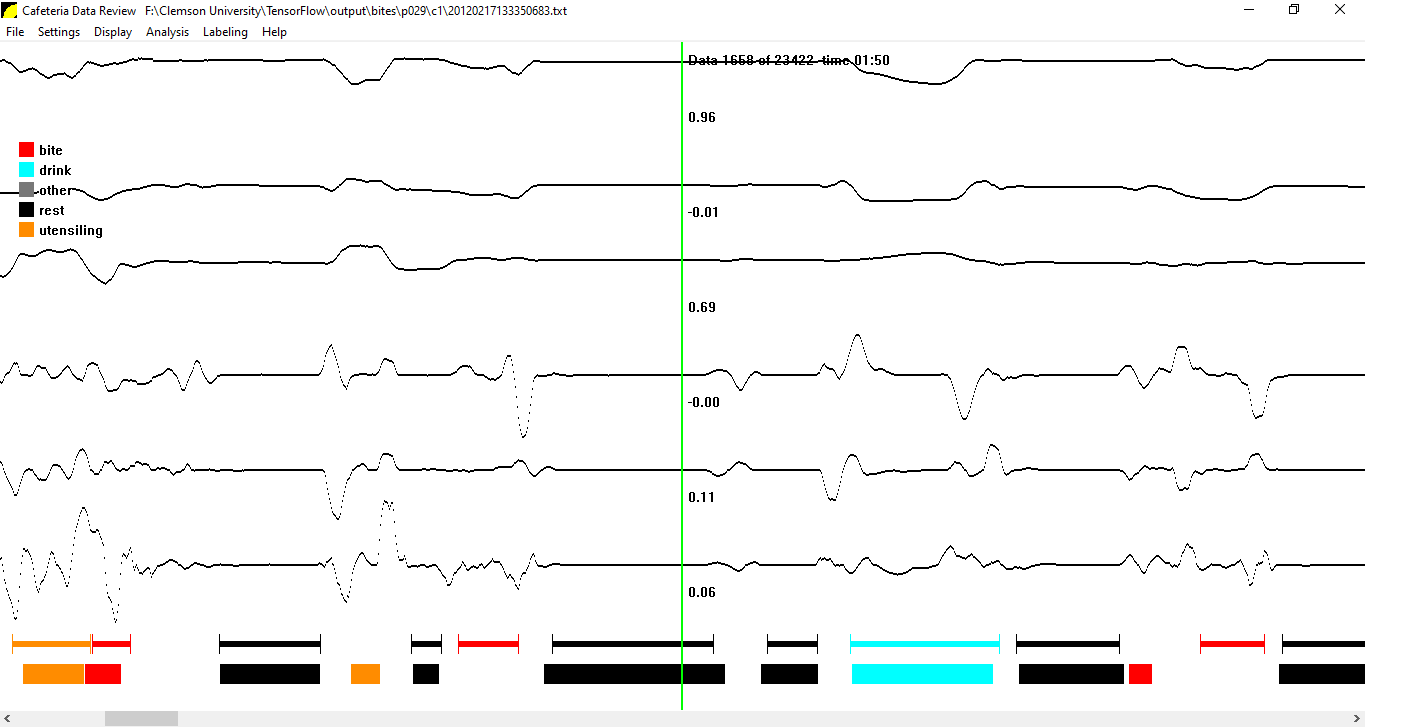
The following figure shows an example, in which a portion of a meal is labeled using our deep learning model. We can clearly see that the model is able to correctly identify many gestures within this small portion of time.
Model evaluation
The deep learning model was evaluated using three stages, with the average accuracy per meal being reported in each case. The first stage evaluated how many indices matched between the ground truth labels and the classifier output. This was the simplest stage of evaluation, but it included a score for matching in both directions, i.e. classifier against ground truth and ground truth against classifier. Such an approach also allows us to perform a sanity check for our model.
Consider two scenarios, one in which the model identifies only a limited number of gestures, but the indices of these match those of the ground truth perfectly. In this case the percentage accuracy of classifier indices would be very high, but that corresponding to the ground truth indices would be low. In the other scenario the model produces a lot of spurious gestures but correctly matches all ground truth indices. This would result in a high accuracy of matching in ground truth indices but a far lower accuracy of matching in the indices labeled by the model. As both these scenarios are undesirable, we need a high percentage of matching betwen both sets of indices. As shown in the table below, the accuracy of the classifier was sufficiently high in both directions, and the standard deviation of the percentage of indices correctly identified was low in each case indicating that the model output does not change much from meal to meal.
| Metric | Ground Truth | Classifier output |
|---|---|---|
| Average | 73.12 | 79.80 |
| Standard Deviation | 14.19 | 9.98 |
At the second stage, we are interested in knowing the accuracy of the classifier at detecting all gestures correctly in each meal. In this case, the ground truth and classifier output were compared based on their overlap. If either classifier output and ground truth had more than 50% overlap in either direction and each had the same label, the model output was considered correct. This was the same if the classifier identified more than one distinct gesture matching with the ground truth.
If the classifier produced no output throughout the segment of time corresponding to the ground truth, it was termed as a miss. However if the classifier had a single output with more than 50% overlap, but the label did not match with that of the ground truth, the response was considered mislabeled. When the classifier identified two or more gestures within the boundaries of the ground truth, but atleast one of these was incorrect, the response was labeled as mangled. Finally if the classifier identified a unique gesture, but none was present in the ground truth, considering 50% overlap from the start and end points of the classifier output, the classifier response was labeled as false positive.
The table shown below lists the average percentage of correctly identified gestures per meal, and the standard deviation of the average percentage in each meal. We see that the classifier is able to identify a large portion of gestures correctly on average per meal, with a reasonably small standard deviation. The percentage of incorrectly identified gesture categories is also sufficiently low, along with low standard deviations in each case. This indidcates that the classifier is robust against changes in wrist-motion and can be reliably used for labeling gestures within each meal.
| Metric | Correct | Missed | Mislabeled | Mangled | False Positive |
|---|---|---|---|---|---|
| Average (% age) | 77.7 | 11.2 | 5.9 | 6.2 | 16.6 |
| Standard Deviation (% age) | 13.7 | 8.4 | 5.8 | 4.9 | 11.1 |
Finally we are also interested in knowing the accuracy of the classifier for each distinct gesture category. This too was evaluated using overlap between classifier output and the ground truth as described above. The following table lists the average percentage of correctly identified gesture categories per meal, and the standard deviation of the average percentage per meal. We see that the average percentage of correctly identified gestures is sufficiently high for each category associated with eating activity. Close to 80% of all gestures corresponding to eating such as 'bite', 'drink' and 'utensiling' were correctly identified in each meal with acceptable standard deviation in each case. The average accuracy of detecting the gesture 'rest' was also similarly high in each meal, with acceptable standard deviation in this case as well. Thus the model can reliably detect these from data present in different meals.
However it was observed that the classifier was unable to identify any gesture from the category 'other'. This was most likely because the recordings contain a lot of variation for this category (owing to the large number of activities collectively termed as 'other' in the labeleing process), while the amount of training data available for this category was a lot less as compared to that available for the remaining four categories. This is an example of an imbalanced data set, and machine learning models, especially deep learning neural networks are known to perform poorly on such data.
| Metric | Bite | Drink | Utensiling | Rest | Other |
|---|---|---|---|---|---|
| Average (% age) | 79.7 | 84.7 | 79.5 | 81.1 | 0 |
| Standard Deviation (% age) | 19.1 | 20.3 | 17.3 | 17.6 | 0 |
Observations & Conclusions
In order to understand the model better, particularly to understand meals in which the model was unable to correctly identify the eating gestures, we plotted a histogram of the percentage of correctly identified gestures in each meal against the total number of meals having that particular percentage. This is shown in the following figure.

We see from the figure that the distribution is long-tailed, trailing sharply beyond 3 standard deviations. This indicates that the meals in which the model is unable to identify gestures are most likely outliers from within the data set.
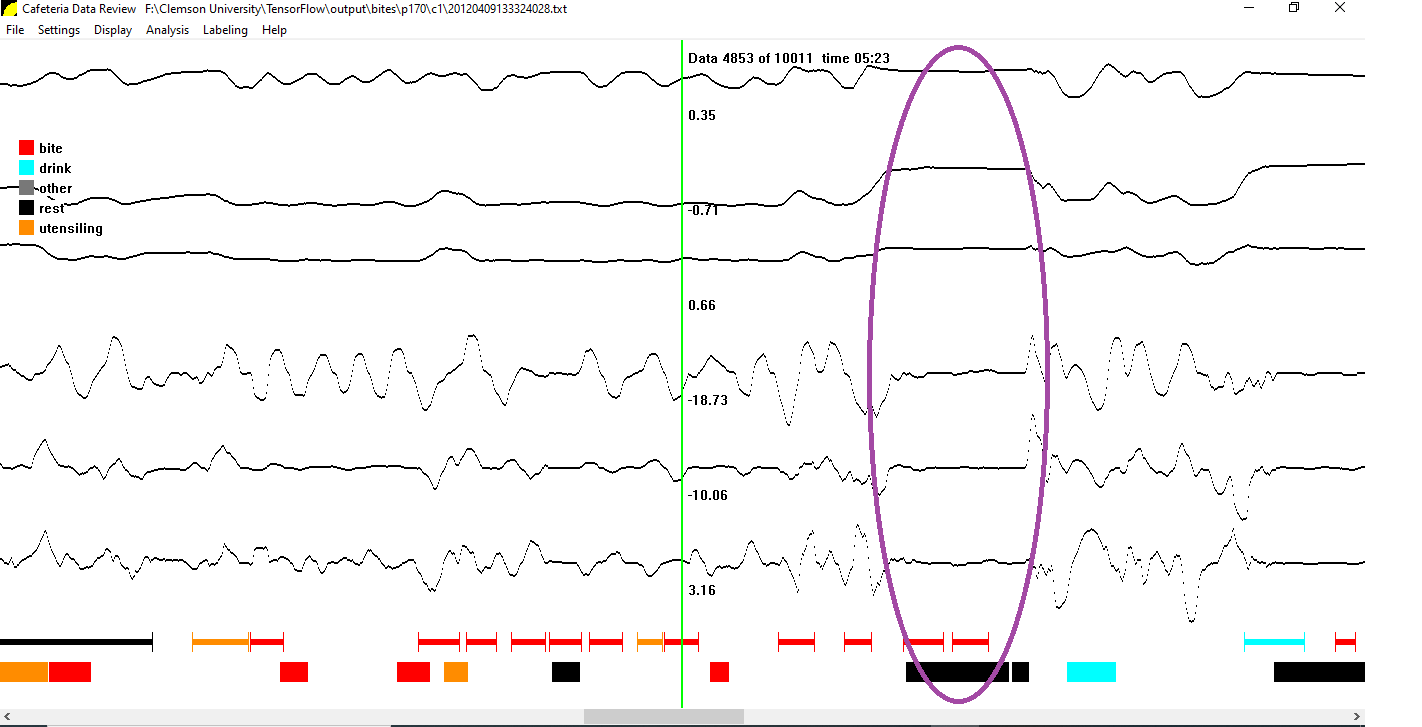
On plotting one meal from this set, we observe that two distinct bite gestures have been identified for a period of recording which clearly appears to be indicative that the instrumented hand (fitted with the recording device) is at rest. This suggests that the rater in this case marked the activity correctly, but did not take into consideration it was occurring due to the uninstrumented hand. Several other meals of this type were identified, and it was observed that the model accuracy was low in each of these. This is thought to be the most likely explanation, as to why the model was unable to correctly identify gestures from a larger set of meals.
Future work
It is known from the principle of symmetry in biology, that motion in one wrist/hand leads to similar motion in the other wrist/hand. Since the overall goal of our research is to be able to identify eating gestures irrespective of the hand used, the next step would be to design a model that can identify gestures from associated wrist-motion in the instrumented hand that occurs due to actual wrist-motion in the uninstrumented hand.
Additionally we also hope to expand the total number of categories of gestures, to include the hand (left/right), the type of utensil used to eat, the category of food etc. We hope that this approach will lead to an improvement in the accuracy of the classifier while at the same time leading to a more insightful model for tracking eating behavior.
Finally we are looking into training a deeper neural network, having more convolutional and deconvolutional blocks than the model considered in this research. We are also investigating other neural networks that could potentially be used to identify gestures belonging to the category 'other' while improving the classifier accuracy as well.